
On 27 July the FCA published its findings on how firms monitor consumer outcomes, drawn from a review of board reports, information requests and a survey of 56 firms across sectors. The framing in the opening pages is unambiguous. Collecting data, listing metrics and reporting MI “will not, by itself, show whether customers are receiving good outcomes.” Firms are expected to explain four things: what their information tells them, how they use it to identify risk, what action they took, and how they judged whether that action worked.
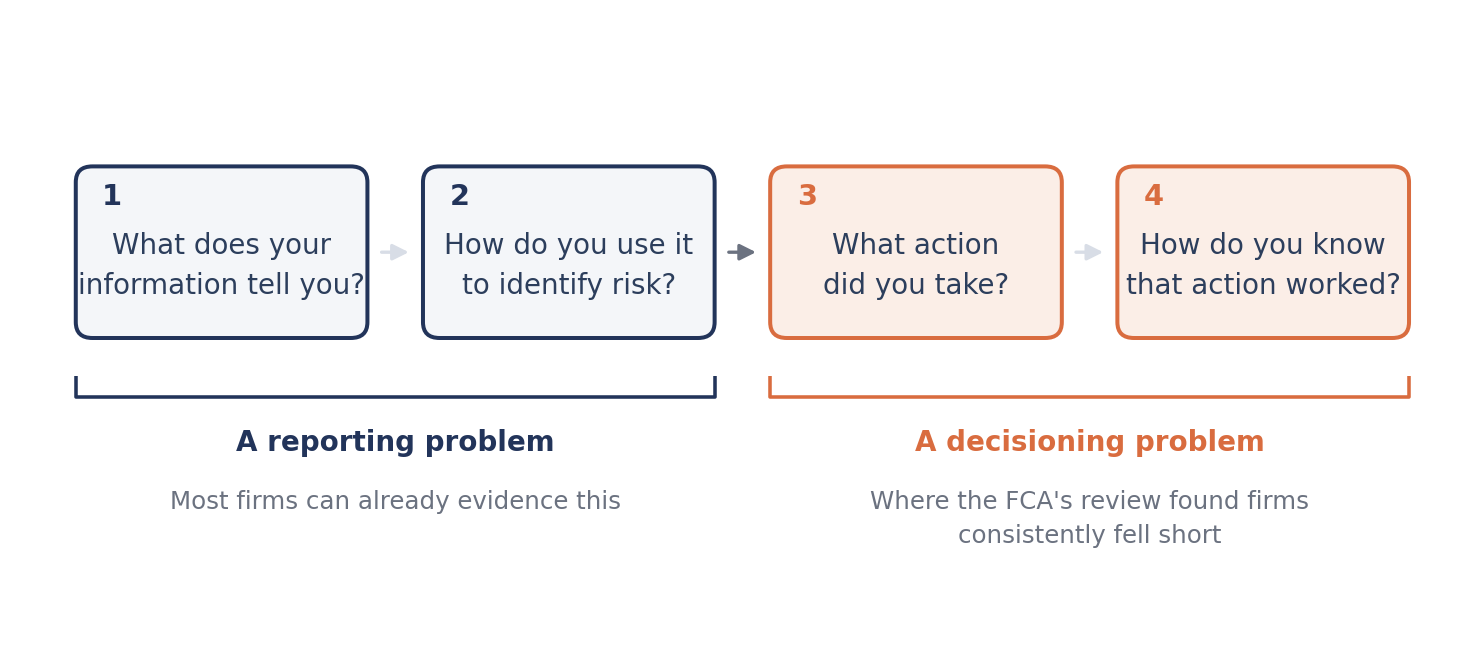
The first two are a reporting problem. The second two are not. And it is the second two where the review found firms consistently short.
Read the areas for improvement in sequence and a single theme runs through all of them. Firms collected relevant MI but could not show how it led to a decision. Thresholds were set but could not be justified. Remedies were agreed but never tested, so the same friction persisted. Boards received regular outcome reporting but, in the regulator’s assessment, tended to review and approve it rather than challenge it. The gap the FCA is describing is not a gap in measurement. It is the gap between knowing and acting.
It is also, by some distance, the question lenders bring to us most often — and it is worth being precise about why it is hard to answer.
Why lenders stall
The honest answer, in our experience, is rarely that the lending team has run out of ideas. Ideas are cheap and most credit functions have a list of them. What is missing is confidence in the underlying data — enough confidence to stake a policy change on it.
This is a rational position. Loosening a decline cut-off, restructuring an affordability rule or standing up a new referral route are decisions with consequences that arrive months later and land on a named individual. Nobody makes those decisions on the strength of an aggregated dashboard built from proxies and lagging indicators. Aggregate MI cannot survive board challenge, because it cannot be checked. It tells you a rate moved. It cannot tell you which customers moved it, or what they did next, or whether the rule you are being asked to change is the reason.
Underneath the confidence problem sits a more practical one: unifying the data at all. Origination, servicing, collections, the bureau feed, open banking and the online journey typically live in separate systems, on separate keys, with separate definitions of the same customer. Most of the effort in outcomes analysis is spent joining them, not interpreting them — and that effort barely scales down. A large lender funds it as a programme. A smaller lender carries the same joining problem with a team of two or three who are also running the book, which is why the resource gap widens sharply as firms get smaller, and why smaller firms so often end up with the most aggregated and most lagging MI of anyone.
The FCA is clear that the Duty applies however big or small a firm is, and equally clear that the response should be proportionate — a focused set of indicators, without complex systems or large teams. That is fair, but proportionality has often been read as permission to evidence less. It should not have to be. Where the data foundations are unified and AI does the joining, matching and pattern detection, the analysis that used to require a dedicated data team is now within reach of a lender that does not have one. The gap between what a large lender and a small lender can evidence is closing, and closing quickly.
For now, though, the common outcome is the familiar one: the MI gets reported, the board notes it, and nothing changes. Which is precisely the failure mode the FCA has written down.
The way through is not more metrics. It is evidence granular enough to be falsifiable — traceable to individual customers, based on observed behaviour rather than inference, and specific enough that a decision maker can be shown to be wrong.
Take the most routine decision a lender makes: declining an application.
What happens after a decline
Decline someone and, for almost every lender, the file closes. The applicant leaves the funnel, the decline rate is reported at month end, and whatever happens next is invisible. But the need that brought them to you does not end at the point of decline — and where an open banking connection persists past the decision, what they do about that need is directly observable.
The FCA’s review does contain one good-practice example involving this population. A firm tested rejected-applicant data to check whether its distribution channels were reaching the intended target market, found that some were not, and ended two paid affiliate relationships as a result. That is genuine good practice, and it is also a question about channel quality: it asks whether these were the right applicants to have received in the first place, and it stops at the moment of decline. It does not ask what became of the people turned away.
That second question is answerable, and the answer is uncomfortable. The figures below come from an outcomes analysis we ran for a UK credit union, following its declined applicants through the 60 days after the decision. The client and the volumes are withheld; the rates are not.
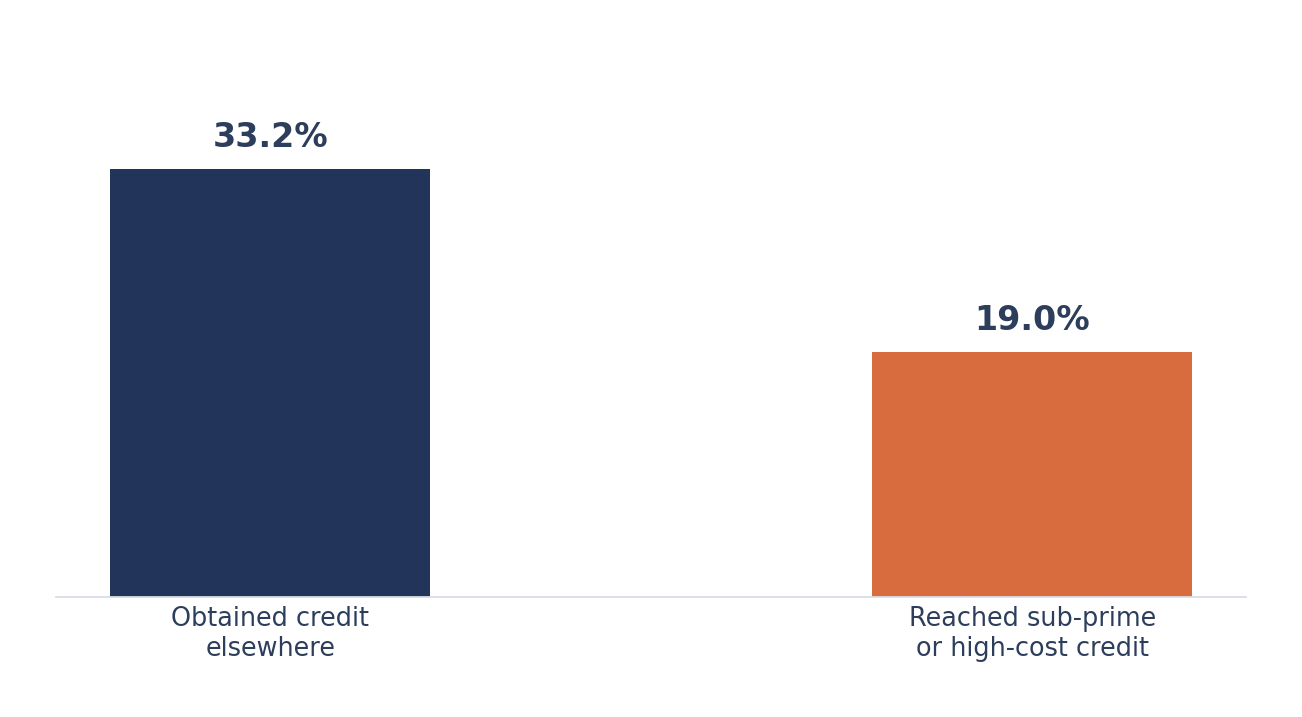
Within 60 days of being declined, a third of applicants had drawn credit somewhere else. Nineteen per cent reached sub-prime or high-cost short-term credit. This is not marginal borrowing at the edges of the population — a fifth of everyone turned away went on to pay high-cost rates for the need that brought them to the lender in the first place.
It is worth being explicit about the size of this population, because it is not a rump. This credit union approves around 45% of the applications it decisions — which means it turns away more people than it funds. The declined pool is already the larger half of everyone who applies, and it is the half nobody looks at after the decision.
For a prime or near-prime lender the imbalance is starker still. Acceptance rates run well below that, so the declined pool is a multiple of the funded book rather than merely the bigger half of it. Declines are driven as much by policy rules, thresholds and channel quality as by affordability. And the applicants turned away are, on the whole, stronger credits — so a far larger share of them will be picked up not by high-cost lenders but by direct competitors.
That changes what the analysis is for. In a mutual, decline-destination data is largely a member-welfare and Consumer Duty instrument with a growth benefit attached. In a prime book it is first and foremost a competitive one: the largest population you hold data on, almost none of it observed after the decision, and every substitution a measurable transfer of volume to a named rival operating on the same information you had. The Duty obligation is identical either way. The commercial case is considerably larger.
The distribution of where they went matters as much as the total, and it should be read twice: once for the harm it evidences, and once for the lending it identifies. Those are different tails of the same chart.
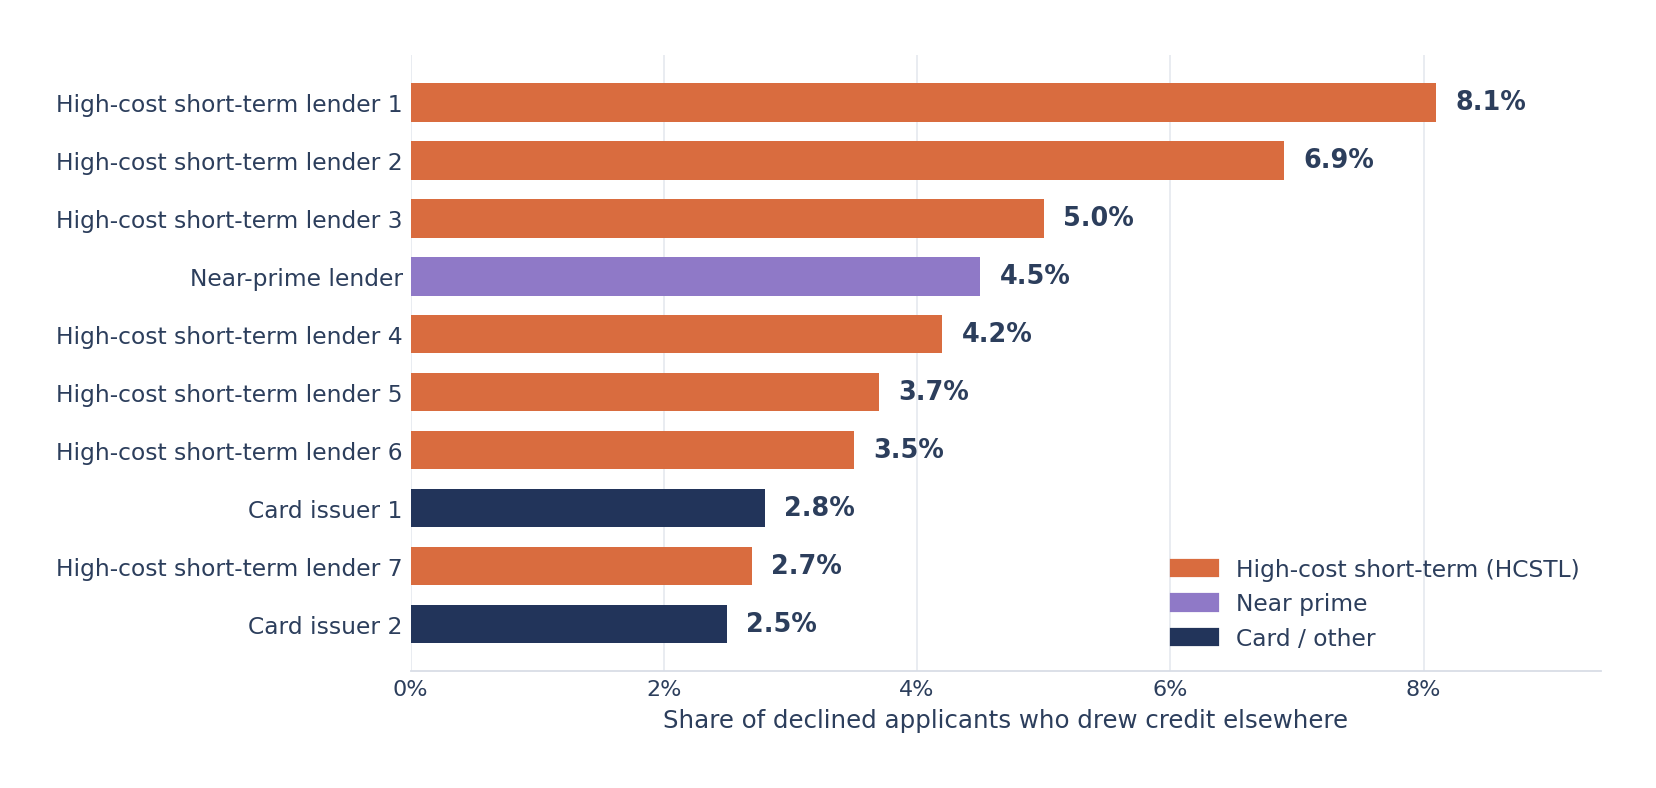
Seven of the top ten destinations were high-cost short-term lenders. That is the harm tail, and it is the one that will get read first.
The opportunity is the other one. The fourth-largest destination was a mainstream near-prime lender, which took a larger share of the declined population than all but three of the payday-style firms — applicants this credit union had assessed as outside appetite, and a conventionally underwritten competitor had assessed as inside it, within 60 days.
That is not a compliance observation. It is a pricing and cut-off observation, and it is the one that changes a lending decision. The customers concerned are identifiable individually, which means the decline reasons are reviewable individually. Reviewing them defines an evidence-based near-miss band: a population where the existing rule was demonstrably more conservative than the risk required, and where a modest cut-off adjustment or a conditional accept — payroll deduction, for instance — recovers lending the book was turning away. The exposure is lower than the scorecard assumed, and there is a competitor’s underwriting decision on each case to demonstrate it.
One dataset, two decisions
The same analysis produced a second finding that points somewhere entirely different.
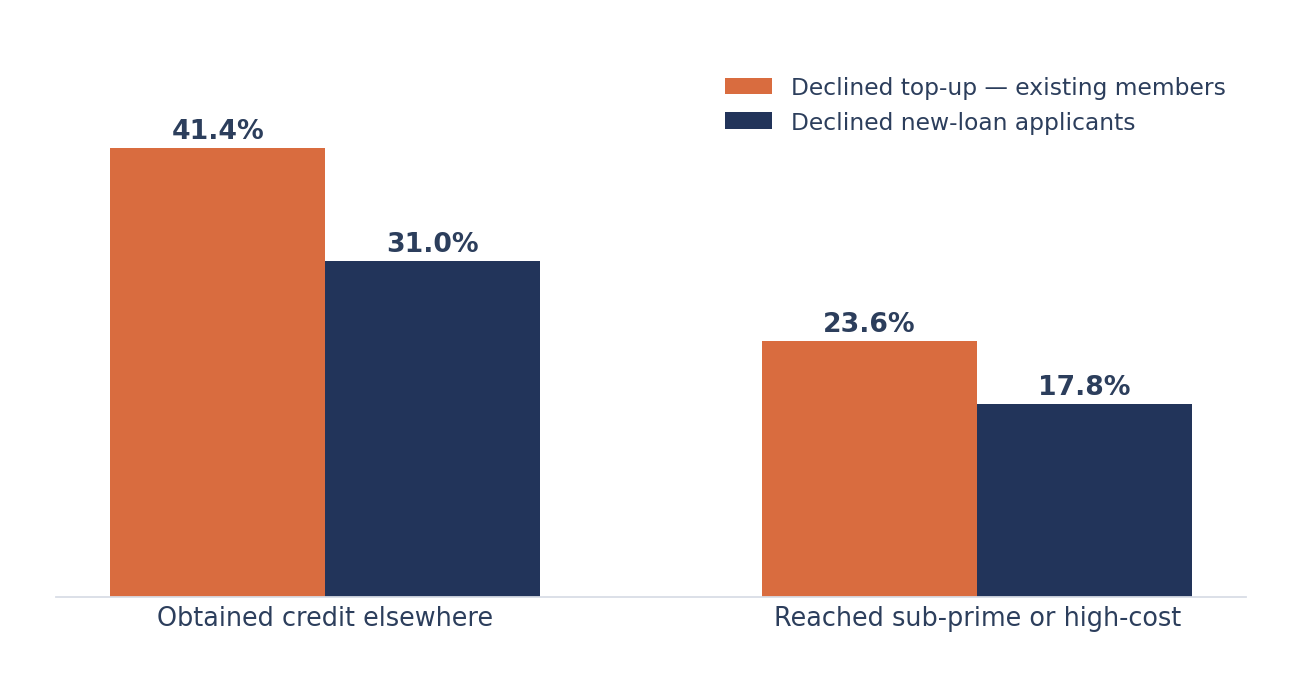
Declined existing members seeking a top-up substituted elsewhere at 41.4%, against 31.0% for declined new applicants, and reached sub-prime or high-cost credit at 23.6% against 17.8%. Both gaps are statistically significant on two-proportion tests — this is a real difference between two populations, not sampling noise.
The interpretation is straightforward. A declined top-up is an existing customer with a live, demonstrated borrowing need and an observable repayment history. Decline them and the need does not go away; within weeks roughly one in four is paying high-cost rates to meet it — while still servicing a loan with you. Treating the two decline populations as one queue is therefore not only a growth question. It is an arrears question, because a customer servicing a payday loan alongside your loan is a materially different credit from the one you underwrote.
Two decisions, opposite in direction, from one dataset: lend more to a near-miss band you can now identify, and handle existing-customer declines differently from new-applicant declines. Neither is a metric. Both are rules.
The same lens, applied to risk
Outcomes monitoring is often read as a consumer-protection exercise that runs against commercial interest. Turn the same lens on the customers you did fund — re-pulling their open banking data at 30, 60 and 90 days — and it makes the opposite case.
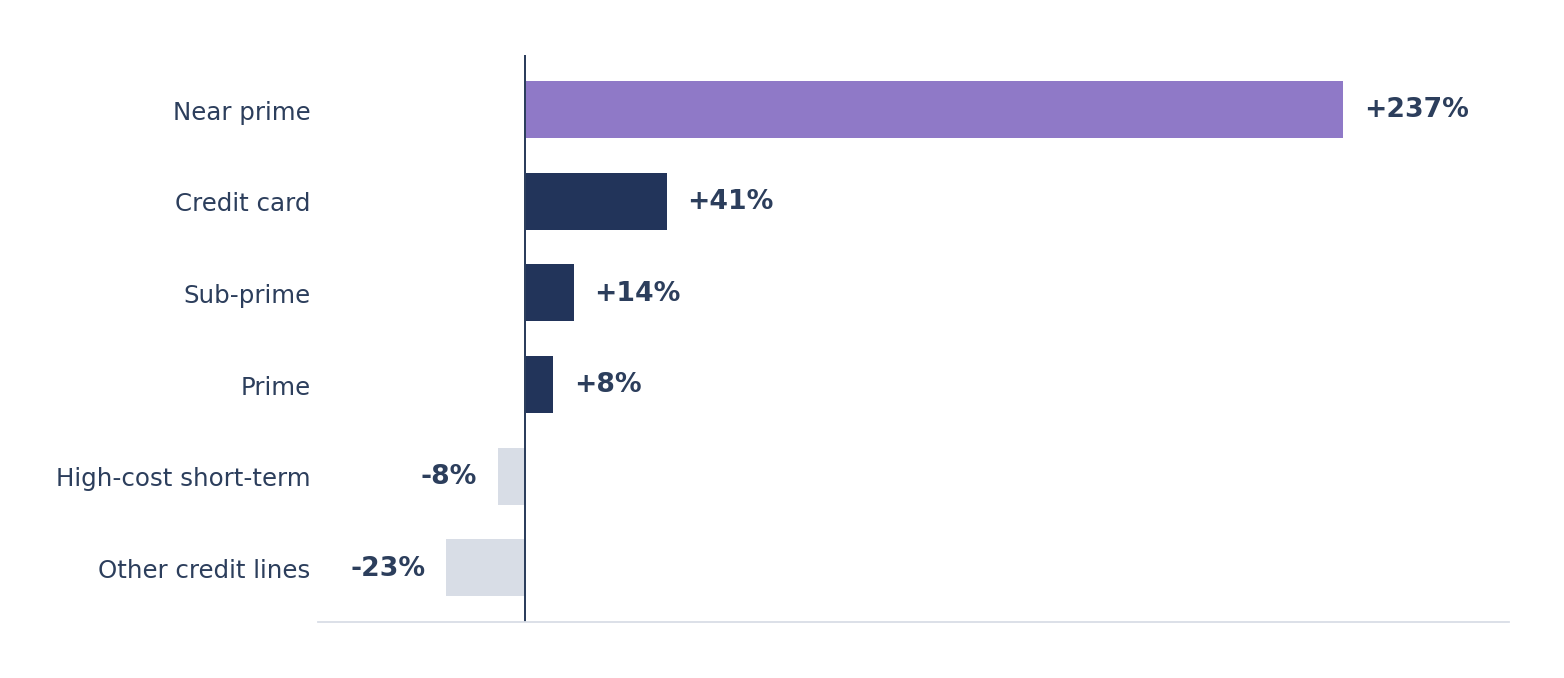
A new loan takes four to eight weeks to appear on a credit file. Inside that window, other lenders see only a search footprint. On a fixed population of customers with full pre- and post-funding coverage, cash drawn from third-party credit lines rose 13% in the 60 days after funding — concentrated almost entirely in near-prime lending, and substantially through a single counterparty. The bureau is structurally blind for that period. An open banking re-pull is not.
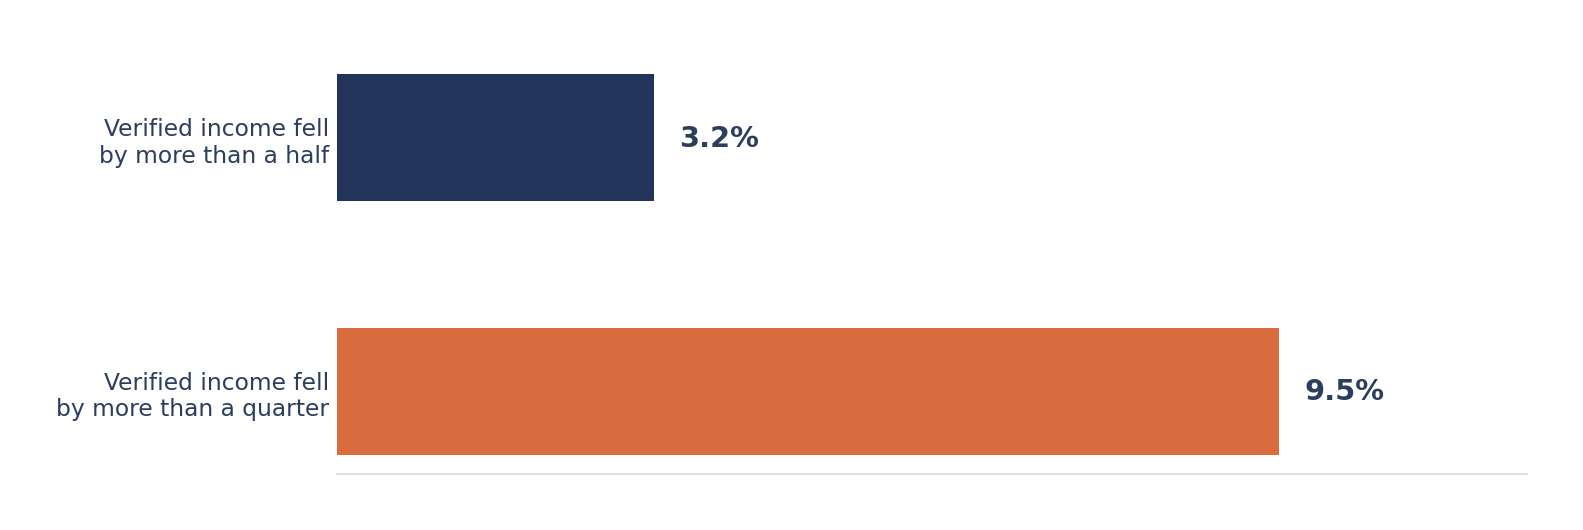
Nearly one customer in ten saw verified income fall by more than a quarter within 60 days; for 3.2% it fell by more than half. Income shock is a leading indicator — people typically run down savings and other credit before missing a payment — which makes this the natural priority list for early, supportive contact rather than a collections conversation three months later.
Not every signal points to a tighter rule, and this is where the discipline matters. The clearest welfare outcome in the entire book belonged to a member whose returned direct debits fell by more than 90% in the 90 days after funding, from a persistent pattern to a single instance. A returned-DD decline rule would have prevented it. The right use of that signal is to route the applicant to the appropriate product and repayment structure — payroll deduction, a payment date aligned to payday — not to decline them.
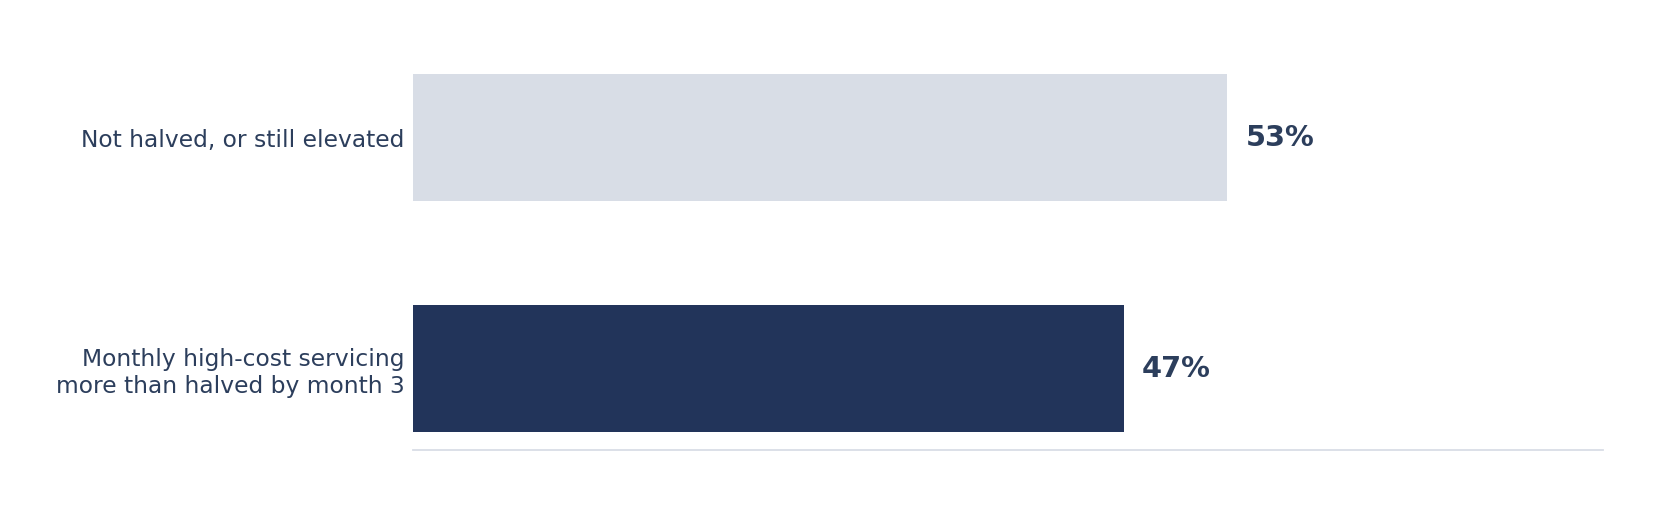
The same holds on the positive side. Among consolidation borrowers with 90-day coverage and meaningful high-cost servicing at application, 47% more than halved their monthly high-cost credit servicing by month three. In the clearest individual case, monthly high-cost servicing was reduced by more than 98% — effectively eliminated. Those are observed payments, not modelled ones — which means the good outcome is evidenced to the same standard as the poor one.
From finding to rule
The FCA is asking for an audit trail: issue identified, cause understood, action taken, effect tested. The chain that produces one looks like this.
| Finding | Feature or rule | Test |
|---|---|---|
| Declines funded by mainstream near-prime lenders | Second-look band on named decline reasons; cut-off adjustment or conditional accept | Fund rate and arrears on the recovered band |
| Top-up declines substitute at a higher rate than new-loan declines | Separate treatment path for existing-customer declines, applied before the decline is issued | Substitution rate and arrears on the cohort |
| Third-party drawdowns inside the bureau lag | New-lender velocity feature at application — referral, not automatic decline | Post-funding stacking rate |
| Pre-application gambling intensity | Gambling-to-income ratio as a scorecard feature, with a referral threshold | Month-one gambling relative to baseline |
| Returned direct debits before application | Product and repayment-structure routing — a support signal, explicitly not a decline signal | Returned DDs at 90 days post-funding |
That is the artefact the review is asking firms to produce, and it is not a reporting artefact. It is a decisioning one.
One further note on data quality, because the FCA’s review singles it out. The paper praises a firm that found payments being categorised incorrectly — HMRC payments misfiled, gambling transactions not consistently recognised — and refined its rules for a 12.8% improvement in accuracy. Our own analysis surfaced a batch of loan disbursements categorised as salary. On re-applications and top-ups that overstates affordability for exactly the customers re-borrowing soonest. Outcomes monitoring is only as good as the categorisation underneath it, and that layer is worth auditing before any of the above is trusted.
Where this leaves the board pack
The uncomfortable implication of the FCA’s review is that a great deal of outcomes reporting is unfalsifiable — it can be presented, but it cannot be wrong, so it cannot drive a decision. Reporting that changes lending policy has to be specific enough to lose an argument.
That is the standard we built the Credit Canary Performance module to meet. It spans origination through to collections with IFRS9 provisioning and regulatory outputs, board packs generated with full data lineage rather than assembled by hand, and drill paths that run from a portfolio trend to the individual accounts driving it. Strategy Agent sits on top, monitoring the portfolio continuously and surfacing recommendations with projected impact — a decline pool matched against another product, an affordability threshold that has become too conservative, a vintage whose arrears profile has shifted — so the finding arrives already attached to an action.
It also does the joining. The lineage, the matching and the pattern detection are the part that used to determine whether a lender could run this analysis at all, and it is the part that no longer depends on the size of your data team.
If your board is receiving outcomes MI that nobody is prepared to act on, the problem is usually the evidence rather than the appetite. We would be glad to walk through what this looks like against your own book — including, if you want it, where your declined applicants went next.
Data drawn from a July 2026 member outcomes analysis conducted for a UK credit union, covering funded loans with a stated purpose and at least 25 days of post-funding open banking coverage, a fixed sub-population with full pre- and post-funding windows for like-for-like comparisons, and declined applicants with at least 55 days of post-application coverage. All findings are reported as rates; client, volumes and monetary values are withheld, and destination lenders are reduced to tier. Full methodology available on request. Source: FCA, “Outcomes monitoring: good practice and areas for improvement,” published 27 July 2026.